“Before we can start troubleshooting anything, we need to first figure out what is wrong. Now I mean this in the most general way. Are we having a problem where the drawing is incorrect? Are we having a problem even getting a drawing to generate when we release? Are we even getting to the point where we can release? Is our computer even able to startup? If the problem is the last one, try turning it off and back on again.
Generally speaking, the process for troubleshooting any issue involves:
- Making sure that the problem is repeatable
- Determining the steps required to repeat the problem
- Performing those steps…all except the last one
- Peeking under the hood (bonnet) to see what is going on
Our friends down on the (Laskey) farm have built some great tools into DriveWorks for peeking at the inner workings of the product. The tools that you will use will depend upon the problem you are having and where in the specification process you are experiencing your “undesirable results.”
Let’s take a look at a few of those tools and the areas where they can help.”
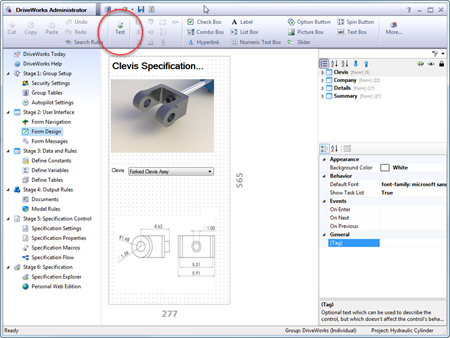
Form Design Test Mode
“Top and center in the form designer is the ‘Test Mode’ button. Form test mode allows you to test a few crucial parts of your project. First, you can check validations that you build into your forms. Minimum and maximum values, list items, default values, table data and more can all be calculated dynamically through control property rules. Test mode allows you to enter various inputs to make sure that your inputs only accept complete, accurate, and manufacturable information.
Control locations, sizes, visibility, text and appearances can all be driven by rules as well, creating a dynamic form to help your users best experience the design of your product. Test mode allows you to ensure that these dynamics are working how you would expect them to work. 3D Preview controls are also “live” during test mode, allowing you to check your 3DEXPERIENCE (as long as it doesn’t require SOLIDWORKS or macros).
The trick about the Form Design Test Mode that most people don’t recognize is that the values that you enter in test mode will persist throughout the remainder of your project. This means that any values that you enter in test mode will be the input values that are used in the calculations in your variables and the lookups in your model rules and in documents and calculation tables and everywhere. Just like you put in values to test dynamics and validations, use test mode to put in test values to test your rules everywhere else within your implementation. And what’s more, these values will persist when you start a new specification. So, if you want values to be prepopulated when the user opens a form, you can just preset them in Form Design Test Mode.”
Specification Test Mode
“If your issues crop up further in the process, while the user is specifying, DriveWorks Administrator also has a Specification Test Mode. This allows you to poke around inside the workings of the specification while it’s running. You can view variable values, see sample output documents, view and even analyze model rules. Because this test mode effectively pauses your specification, this is the tool that will show you the state of everything right before it goes south. Here you will typically find the #VALUE! that is causing your problems.”
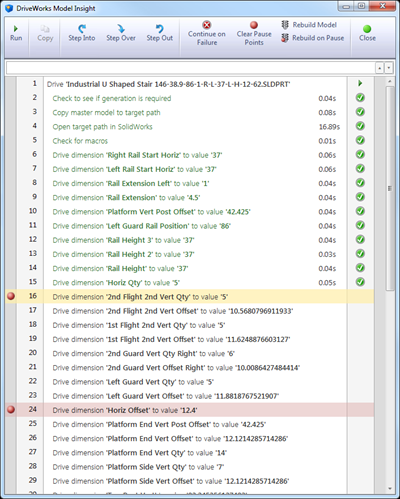
Model Insight
“Inside of specification test mode, you can view the values that are going to be used to drive your SOLIDWORKS models and drawings. The next step forward is to actually generate those models. Model Insight (a fancy name for generating test models) allows you to generate any component or assembly in the tree. This will allow you to easily troubleshoot one part without having to release the 42,412 other parts, assemblies and drawings. You can use the OnDemand model generation engine, but Model Insight kicks in when you choose to generate the model using Queued, Interactive generation.
Queued generation is the method used by Autopilot and by SOLIDWORKS when going through the Model Generation Queue (blue cube-like icon). The interactive part is that DriveWorks provides a complete list of tasks to be performed and you can walk through the model generation line by line, like a debug mode in a program or macro. You can set breakpoints, tell DriveWorks to stop when it hits an error, or you can tell it just to plow through. You can view API events (for those of us that use and write Model Generation tasks) and you can always scroll back to look at the details of the tasks performed. And yes, this will even run model generation tasks as well as SOLIDWORKS macros on the models and drawings.”
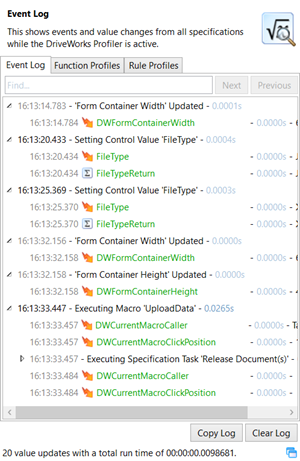
Profiler
“Probably the least known tool in the DriveWorks troubleshooting arsenal is the profiler. The profiler shows you, in real time, every step that DriveWorks is performing and when I say “every step”, I mean EVERY STEP. Every value that gets calculated and recalculated, every table that is synchronized, every step of every specification macro, even the updating of the form size variables is shown in the profiler window. This can create quite a massive list of events to sort through and the sheer act of recording all of these steps to the window can significantly affect your performance. So the profiler is generally not the first weapon that we pull to attack an issue.
While the profiler will affect your performance, it will also report back about that performance, showing how long each task and calculation took to perform. This is very useful for identifying the source of slow specifications, forms and releases.”
Reports
“Some of the information that the profiler provides is recorded in the specification, release and model generation reports that DriveWorks creates. In the Settings dialog, you can set the level of detail for specification reports and for model generation reports, and PDM Pro reports all separately. Verbose mode is great for troubleshooting, but should only be enabled when you are actually troubleshooting. Much like the Profiler, this reporting mechanism can log a lot of steps and can significantly affect the performance of your specifications.
Each model generation gets its own model generation report. This means that sub-components that are generated, then swapped into an assembly will have their own report. This also means that if a model generation “terminates less than gracefully”, each generation context will have its own report. This will allow you to see exactly where the generation guardian angels looked away.
Listen up, those of you that work with the DriveWorks SDK to write your own specification tasks, model generation tasks and even project extenders. As a developer, you have the same access to the report writer as the DriveWorks folks do. USE IT! You can set the reporting level for each entry along with the various pieces of information in the row. This controls which report entries are only written when verbose is selected. Additionally, you can utilize BeginProcess to create the collapsible sections within the report (just don’t forget your corresponding EndProcess).”
The List Goes On…
“Troubleshooting tools exist all throughout DriveWorks (one might even say they’re “pervasive”). From the Values, Steps and Drill Down tabs in the rules builder to the Preview modes in documents and calculation tables, the tools are plentiful. Which to use all depends on the type of troubleshooting and where in the specification process you currently reside. So before you phone up your handy dandy reseller tech support, take a look at the steps that you are performing (you document them before you call for support, right??) and take a look for the troubleshooting tools that are right there inside of DriveWorks Administrator. You just might be able to save yourself from that awkward moment when you have to admit that the “bug” that you found in DriveWorks was actually a cricket that you wrote into your rule.”